Unlucky not to have had better results
20 Aug 2018
Expected goals, commonly referred to as xG, explained in a really simple manner is a number between (0 and 1) that can be given to a shot, which tells you the likelihood of that shot leading to a goal. If someone shoots from 50 yards out on the wing, it’s much less likely to go in than a close range shot in the middle of the goal.
I know xG (expected goals) is largely ignored in the football community (rightly so on many occasions) unless you’re a nerd, like me! However as it is used on match of the day, increasingly in newspapers and massivly by betting tipsters it is starting to be of interest to more and more fans
In my opinion, it is also the fairest reflection on how a game ‘panned out’, although obviously the result is a million times more important.
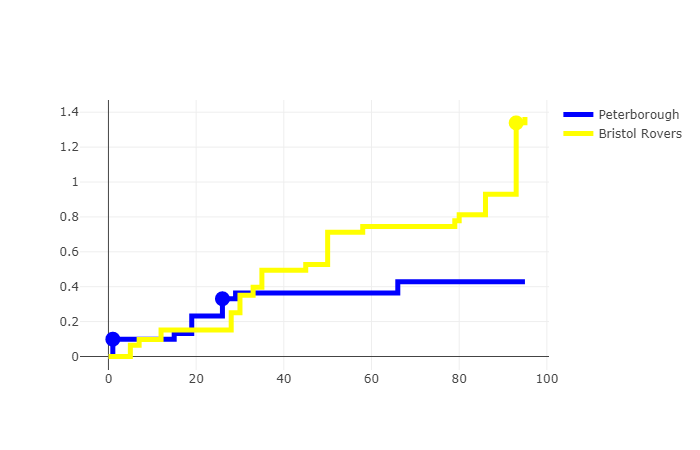
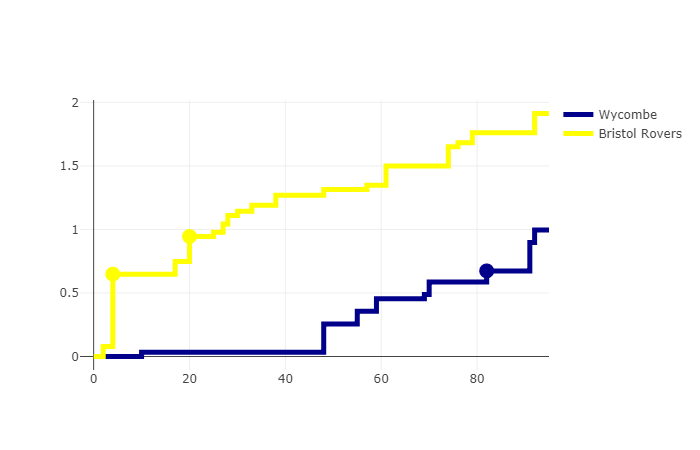
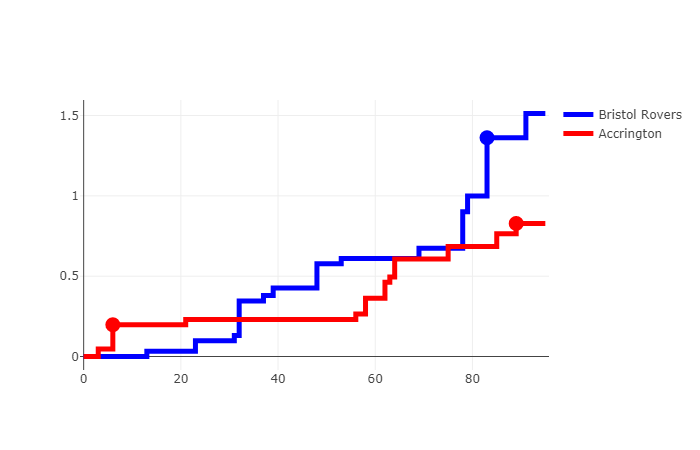
The reason I have calculated the xG of each of our chances and put them into the below charts (showing our cumulative total xG) is because at a glance they show what I saw in person… that on another day with just more clinical finishing the results could have been massively different
Wycombe (away)
Accrington (home)
Peterboro (away)