Recruitment Analysis Continued: Harrison v Payne
25 Oct 2018
When reviewing Clarke’s summer transfer business the most difficult aspect was always going to be replacing Harrison
Last year we signed Sercombe which was phenomenal and we don’t need any depth of analysis to show how important he has been (or will be) for us
I can’t remember the last time we signed a striker that had previously had success at league one level. Possibly Jamie Forrester when on his way back down the footballing structure?
I think Payne will go from strength to strength with the coaching team at Rovers…. But for now lets just compare his numbers to Harrisons. It shows why Clarke and Widdrington (the clubs head of recruitment) signed him.
This is also why I don’t think anyone was complaining about the signing at the time, and won’t be in years to come
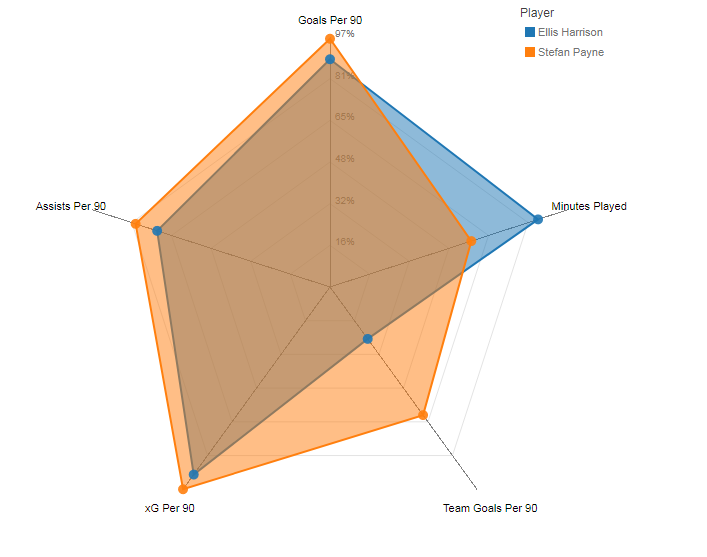
Chart explained
xG per ninety has been explained by people across the Internet better than I can, but you can think of it as how many chances they managed to get, but with the quality of chances also factored in. A player who receives the ball in a shooting position (and gets a shot away) ten yards out every game has a higher xG per 90 than someone who shoots once from distance at a tight angle.
Chart Method
I’ve been gathering data on all the match events in league one for nearly two years. I then calculated the value for every player in these specific statistics and worjed out Payne and Harrisons ranking against all the other players. Finally I converted their rank to a percentage for integration with my radar visualisation